Abstract:
In this project, we built on the previous work of researchers to create a more complete and accurate digital version of the Itinerary of King Edward I from his crowning in 1274 through his death in 1307. This document includes a detailed description of how we chose to undertake this project, what source materials we used, the specific issues that we encountered, the methodology that we used to address those issues, the quality of the resulting data set, and suggestions for future improvements of this data set. While this document does include maps and animations depicting the completed dataset, we do not provide any interpretive analysis of that data. The goal of this document is to provide enough information about this dataset so that those who wish to use it in the future will understand its strengths and limitations, and those wishing to improve on the quality of the data will have a strong foundation to upon which to build.
Getting Started:
In the spring of 2026, we had the opportunity to meet Scott Lloyd, an historian at the Royal Commission on the Ancient and Historical Monuments of Wales. In an email, Scott sent us a link to a digital file listing the itinerary of King Edward I. Over the past few months, we have been able to take that amazing data set, clean it up, update it, fix some errors (hopefully not introducing too many new ones), and then map it in a way that has helped us to better understand Edward’s travels throughout his reign.
Here are links to the new dataset that we created, as well as some maps.
Below is a more complete description of the source data, the original digital dataset compiled in 2019, and the work that we have done to try to improve that dataset.
Original Source Material:
In 1900 barrister and historian Henry Gough published a two-volume set of documents titled: “Itinerary of King Edward the First Throughout His Reign, A.D. 1272-1307, Exhibiting His Movements From Time to Time, So Far As They Are Recorded. Extracted from the Records of England.”
As titles go, it’s a mouthful, but it tells you pretty much everything you need to know.
The work was commissioned by John Crichton-Stuart, 3rd Marquess of Bute. Bute is an island off of the eastern coast of Scotland, and the Marquess seemed to have an historical interest in the English conquest of both Scotland and Wales. In 1898 Gough had published a volume titled “SCOTLAND IN 1298. Documents Relating to the Campaign of King Edward the First in that Year, and Especially to The Battle of Falkirk.” (the man clearly understood how to craft a title), and, in the forward to the itinerary, he explained to his patron:
“In considering the history of a country scarcely any document can be of greater interest than a faithful record of the daily movements of its ruler. During an invasion, a similar interest attaches to a narrative of the daily progress of the leader of the hostile army; nor is the case materially different if the incursion be rather political than warlike. The value of a well-authenticated statement of the progress from day to day of King Edward I during the whole of his reign will therefore doubtless be generally recognised.”
So it seems that this work was compiled out of a motivation to document Edward I’s campaigns against Scotland. This idea is also bolstered by the fact that there is an extended section in the end of the second volume entitled “King Edward’s Expeditions into and Against Scotland.” This section includes maps of specific “expeditions” that we will later examine in more detail.
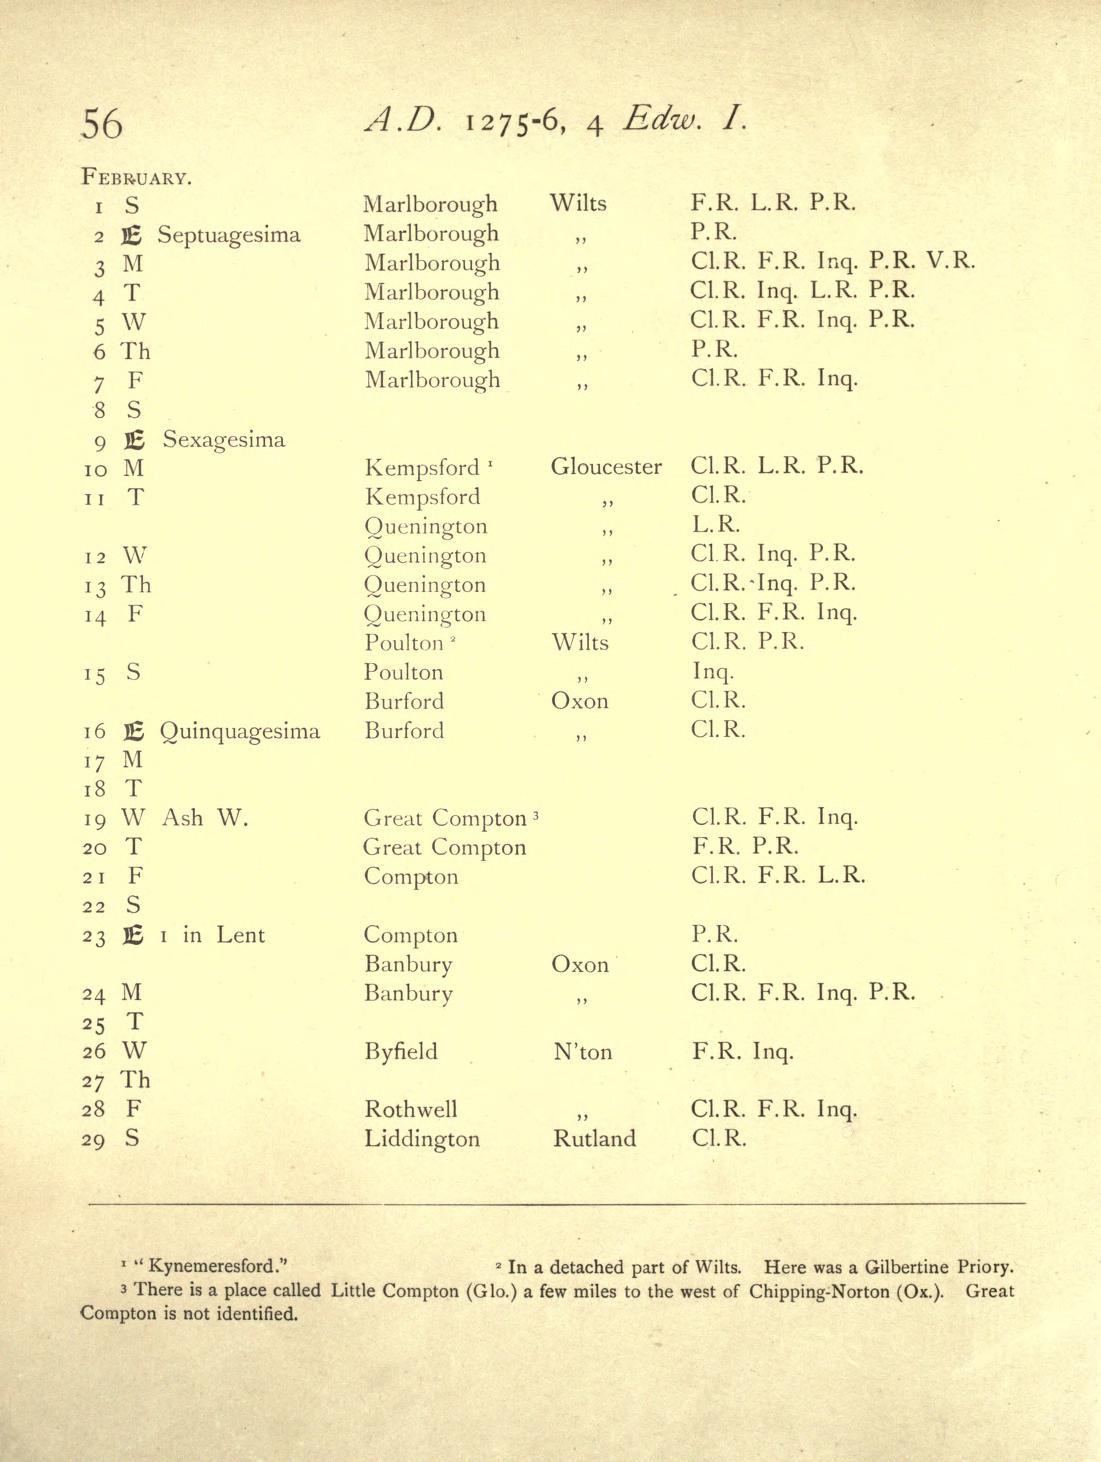
Figure 1
The main body of this work, however, consists of hundreds of pages, each consisting of a simple table listing dates, locations, and citations for that information. Each page represents an entire month of this itinerary (e.g. Figure 1). In addition, there are copious footnotes that are often essential to properly interpreting the information in the table.
It should be noted that we used both publicly available digital scans of Gough’s documents as well as a printed version that we purchased. However, the printed version (which was also based on scans of the original) did NOT include the vast majority of the footnotes. This omission often excludes information that is critical to accurate interpretation of the data in the tables. For that reason, all of our references to these documents should be assumed to refer to the public domain digital documents linked below.
In addition to Gough’s work, in 1974 E.W. Safford published an updated itinerary of Edward I. Unfortunately we were unable to obtain access to that document for reference purposes.
Gough’s Itinerary of Edward I:
Volume 1: https://archive.org/details/itineraryofkinge01gouguoft/page/n19/mode/2upVolume 2: https://archive.org/details/itineraryofkinge02gouguoft/page/n11/mode/2up
Original Digital Capture of Source Material:
In 2019-2020, Charlotte Tomkins, Dr. Tom Stafford, and Dr. Charles West undertook the task of digitizing and analyzing a portion of Gough’s Itinerary of Edward I (specifically the data from 1277-1307). The resulting dataset “was extracted from Henry Gough’s Itinerary of Edward I, … although some revisions and additions to the data were taken from Spufford’s [sic] revised Itinerary of Edward I (Index version)”. In addition, they made the decision to fill some gaps in the data when it seemed logical.
The Tomkins et. al write-up and source data can be found here: https://doi.org/10.15131/shef.data.8948699.v1
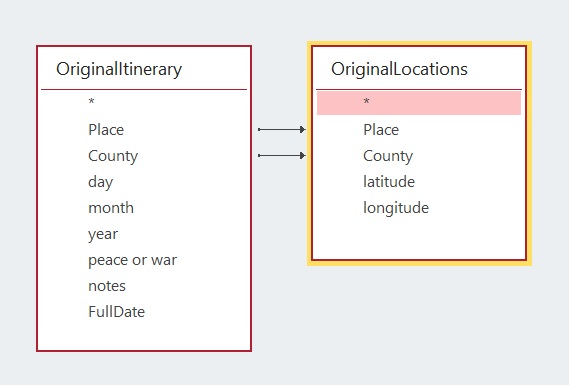
Figure 2
The resulting dataset, as we downloaded it, consists of two separate tables (see Figure 2):
- The first of these is the “Itinerary” table, consisting of entries for 7,763 dates. Dates without listed locations in Gough’s document are coded as “Unknown” in the data, and comprise 1434 entries. This table includes “Place” and “County” fields that identify the placename as well as the county in which it resides. In addition to the date and location information, there is a field that indicates whether England was in a time of peace, or at war on the given date.
- The second of these data tables is the “Location” table. This table is a list of 891 locations that, like the “Itinerary” table, includes “Place” and “County” fields. In addition there are latitude and longitude fields that Identify the actual location of these places as mapped.
One of the limitations of this database design is that it does not easily accommodate multiple locations for one date. Initially we did not realize that this was an issue with the source data. Tomkins et. al made the choice to enter only one location for every date into the database, choosing among the listed locations. We believe this is not an unreasonable compromise, based on the scale of the project and the purpose of the database (i.e. displaying the pattern of movement of King Edward I for the entirety of his reign). When we started our work on this project, we did not initially recognize this limitation. However, by the time we did, we realized that it would require an impractical amount of time and effort to modify the data structure and then manually revisit the entire body of source material.
Tomkins et. al also provide a list of geographic coordinates of castles, as well as borders (those of Wales and Scotland). Since there are other sources of that information available on-line, we did not make use of the data in these two tables.
Initial Data Quality Testing:
Because I am old (Dan speaking here), we used MS Access as the relational database software for manipulating this dataset. We imported the data into MS Access and did a series of checks to find basic errors in data integrity:
- Checking for duplicates in the list of “Locations”, including minor mis-spellings. (We found only three obvious duplicates in our initial check)
- Checking that there are no “orphan records” in the “Locations” table. In other words, locations that are not referenced in the “Itinerary” table. (We found 18 of these)
- Checking for “orphaned records” in the “Itinerary” table. In other words, itinerary records without linked records in the “Locations” table. (Ignoring itinerary records with “unknown” locations, we found 674 of orphaned itinerary records)
The vast majority of these problems are simply transcription or typographic errors and omissions. They are not technically difficult to correct, but can sometimes be time consuming. We removed duplicate places and ensured that all of the relevant records in the “Itinerary” table referenced the appropriate record in the “Locations” table. We made a unique list of missing locations from the orphaned “Itinerary” records. We fixed obvious typos, but some issues required us to add new locations to the “Locations” table, including the latitude and longitude values.
Adding these new location records, we quickly discovered that it was not always easy to find the physical location of the named place from the database. We developed a strategy of using Google Maps to search for the correct placename in the correct county.
Mapping and Animating the Data:
Once we had full referential integrity in the database (no orphaned or duplicate records), we joined the “Itinerary” table with the “Latitude” and “Longitude” fields in the “Locations” table and imported that data into ArcGIS in order to look at it spatially.
Initially we just performed visual spot-checks of the locations to ensure that the points and labels corresponded to actual locations on the map. Because of Sarah’s focus on Wales, we looked mainly at those data. We won’t enumerate all of the errors that we encountered and fixed, but here are a couple of examples.
- There was a location in the middle of Anglesey labeled “Castrum Cuby.” We recognised this as an Anglicised misnomer for Cybi’s Fort, or Caergybi (the Welsh name for Holyhead).
- One piece of information that caught Sarah’s eye was Edward visiting Bala and spending quite a bit of time there that included quick trips back and forth to Caernarfon. Because of her interest in Edward’s movement through Wales in 1284, she could not figure out why he had been in Bala. More importantly, the distance between Bala and Caernarfon (more than 40 miles) made the frequent trips as recorded in the itinerary impossible. When we looked at Gough’s source material, Bala was clearly listed. However, we eventually noticed in the footnotes that “Bala” was, in fact, a reference to “Baladeulyn.” Baladeulyn is the site of a former palace (or llys) of the rulers of Gwynedd where Edward was known to have spent his 45th birthday, the exact time in question, and is located in the Nantlle Valley about ten miles travel from Caernarfon.
As we were catching these errors, we realized that there were likely many more similar errors in places with which we had no familiarity, and that it was unrealistic to believe that we could identify many of them. However, we tabled (ha, ha) that problem for the moment, and moved on to animating the entire dataset.
ArcGIS has the capability to create flexible animated maps, and the structure of our dataset made it easy to quickly produce the animation that you see below. Almost immediately, we realized that there was a gap in the animation, which examination of the data table revealed to be from December 31, 1285 to January 1 1295: nine full years. At first we thought there had to be an error in our work that had inadvertently deleted these records, but we went back to the original CSV files downloaded from Tomkins et. al and discovered that the gap was, in fact, a problem with the source data.
Identifying and Data Gaps In the Itinerary:
The discovery of missing dates in the “Itinerary” table made us realize that we needed a more systematic approach to ensuring that the dataset was complete and had no duplicate dates. Searching for duplicates, a fairly simple automated task, yielded a small number that were easily fixed.
Identifying missing dates, however, was a little more tricky. We used a python script to create a list of valid dates from August 1, 1274 (shortly before Edwards arrival in England following the death of his father) through July 7, 1307 (the date of his death). This covered the entirety of his effective rule (before August of 1274, Edward was overseas, returning from Crusade, and Gough’s itinerary is pretty sparse for this period).
Now having a table of valid dates, we were then able to compare it to the dates populating the “Itinerary” table. Using this technique, we identified another three month stretch of missing dates (September 30, 1283 through January 1, 1284), as well as eight more missing dates scattered throughout the entire dataset.
The one last anomaly that we had to deal with was the date of Feb 29, 1300. In the Julian calendar this is a leap year day, but in the Gregorian calendar it is not. Thus the date data type in modern databases does not support this date. As a workaround, we created a duplicate of Feb 28, 1300, but identified it in the notes field as representing the problematic leap day.
Filling Itinerary Data Gaps:
As mentioned above, while the Tomkins et. al dataset only purported to cover the dates from 1277-1307, we decided that, since we already had to go back and fill in the missing data gaps, it would be useful to also add data from August 1274 through the end of 1276. This would create a complete dataset beginning on the date that Edward arrived in Dover on his return from crusade and ending with his death.
We used the digital copies of the Gough document as our source material. It took us a little time experimenting to develop a consistent methodology for data entry. However, we were pretty dialed in after a couple hundred records. All that is to say, there is a greater likelihood that errors could have been introduced in that initial learning phase of data entry. However, the following is the methodology that we settled upon:
- Use automated processes to create new records in the database for any missing date. These new records are flagged so that we can find them with a query to ensure that we have not missed the data entry on any of them.
- Add locations to the new dates in the “Itinerary” table using existing records in the “Locations” table. The database has enforced referential integrity, meaning that we cannot enter a new location in the “Itinerary” table unless it exists in the “Locations” table. Therefore, when we came across new locations (not already in the “Locations” table), we would add those to the “Locations” table, and then reference that new record in the “Itinerary” table. We ran into some problems with locations with the same or a similar name in different counties, but we believe we caught most of those errors in subsequent checks that we will describe below.
- For new locations that did not already exist in the “Locations” table, we used Google Maps to retrieve the latitude and longitude values. We were able to cut and paste those values into the “Locations” table in order to minimize the risk of typographical errors.
- In a number of cases, finding the location named in Gough proved to be difficult. For these, we would plot Edward’s itinerary as a walked route using Google Maps navigation features. This gave us a plausible search area, and using this combined with general internet searches we were able to develop reasonable hypotheses for almost all locations. Through this process, we also started developing a “certainty” rating for each location that we will describe in detail below.
One issue of note in this data entry exercise is that roughly three years of the missing data between 1285 and1295 covers a time when Edward was in France. Gough’s information for large stretches of that period is sparse and often suspect. It may be that there is a dearth of historical records covering this time period, but it also may be that this was simply not a priority for Gough.
After much flailing and gnashing of teeth, we finally had a complete dataset of every date from August 2, 1274 through July 7, 1307. This comprises 12,028 days. Of those, we have known locations for 10,242 days, or 85% of Edward’s reign. During this time, according to this data set, he visited 1277 different locations. The obvious question is, “How good are these data?”
More QA/QC (Quality Assurance/Quality Control):
In order to get a more systematic look at our data quality, we established “certainty” indices to both our “Locations” and “Itinerary” tables.
Locational Certainty:
We added a “certainty” field in the “Locations” table so that we could note concerns with the accuracy of a particular location, but also indicate if we added that location or made changes to it.
We coded locational certainty as follows:
- Unchallenged: Places that we accepted from the original dataset of Tomkins et. al. We did not independently verify many of these locations, but they all seem perfectly plausible on a cursory examination. These constituted 769 locations in the database.
- High Confidence: Places that we either added or moved (because of an obvious error), and for which we were confident in our ability to identify correct locations on the map. There were 445 locations in the database that fell into this category.
- Questionable Confidence: Places that we either added or moved (because of an obvious error), and for which we were reasonably confident, but still some reasons to doubt. Often these are places where we found a placename on the map, but couldn’t find clear documentation to back it up. There were 34 locations in the database that fell into this category.
- Low Confidence: Places that we either added or moved (because of an obvious error), and for which we were not particularly confident. There were only 4 locations in the database that fell into this category.
- Unplaced: Place names that we were simply unable to locate on the map (and thus end up unmapped in the itinerary). An example of one such place is “Thlegh in Keynmeir” listed in Denbighshire, Wales. This is likely a bad anglicisation of a Welsh placename, but we were just never able to figure it out. In the end, we had only 23 places that fell into this category.
Itinerary Certainty:
The locational certainty field provided the foundation for our assessment of the certainty of the itinerary data. However, the certainty of the itinerary data also hinged on whether or not the path that the itinerary plotted was plausible, or even possible.
While filling in missing data gaps, it became clear that some of the purported distances that Edward’s court would have had to travel on a given day were either unlikely or impossible. We wrote a python script in order to systematically identify daily travel distances that seemed implausible. That script did the following:
-
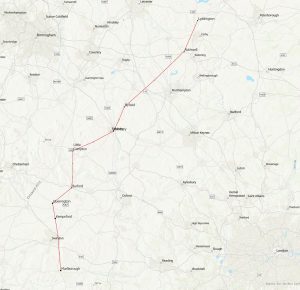
Figure 3
First, the script interpolated locations for itinerary dates without a known location. For example, Figure 1 (above) lists Edward as being in Marlborough, Wiltshire on Feb 7th and Kempsford, Gloucester on Feb 10, with no known locations for the intervening two days. Our script would calculate locations for the 8th and 9th of February based on a straight-line path between Marlborough and Kempsford. In another example from Figure 1, Edward is listed in Compton, Oxfordshire for both the 21st and 23rd of February. In this case, the algorithm would guess that Edward simply stayed in Compton on the 22nd as well. Figure 3 illustrates this mapping of these data.
- Second, the script then calculates the distance along the straight-line path and stores it as a rough guide to the distance that Edward would have had to travel on each given day of his itinerary.
- Third, the script automatically added a “certainty” field to the itinerary data. We used the straight-line distance traveled to that location to flag potential errors. If the distance was less than 20 miles, it was marked as plausible; between 20 and 40 miles was marked as implausible; and a distance of greater than 40 miles was considered impossible. Using this criteria, the script classified the certainty for each day in the itinerary as follows:
- The locational certainty code, as discussed in the section above was assigned to the itinerary date. However, under the following circumstances that code was superseded.
- For all specified locations in the itinerary table, if the distance traveled to that location on a given day exceeded 20 miles, the locational certainty code was superseded with one of the following:
- Implausible Distance – location between 20 and 40 miles from the previous day
- Impossible Distance – location more than 40 miles from the previous day
- For all interpolated locations in the itinerary table (as described in bullet point 1 above), the locational certainty code was superseded with one of the following:
- Estimated Static – estimating that Edward did not travel on that day
- Estimated Plausible – estimating a location less than 20 miles from the previous day
- Estimated Implausible – estimating a location between 20 and 40 miles from the previous day
- Estimated Impossible – estimating a location more than 40 miles from the previous day
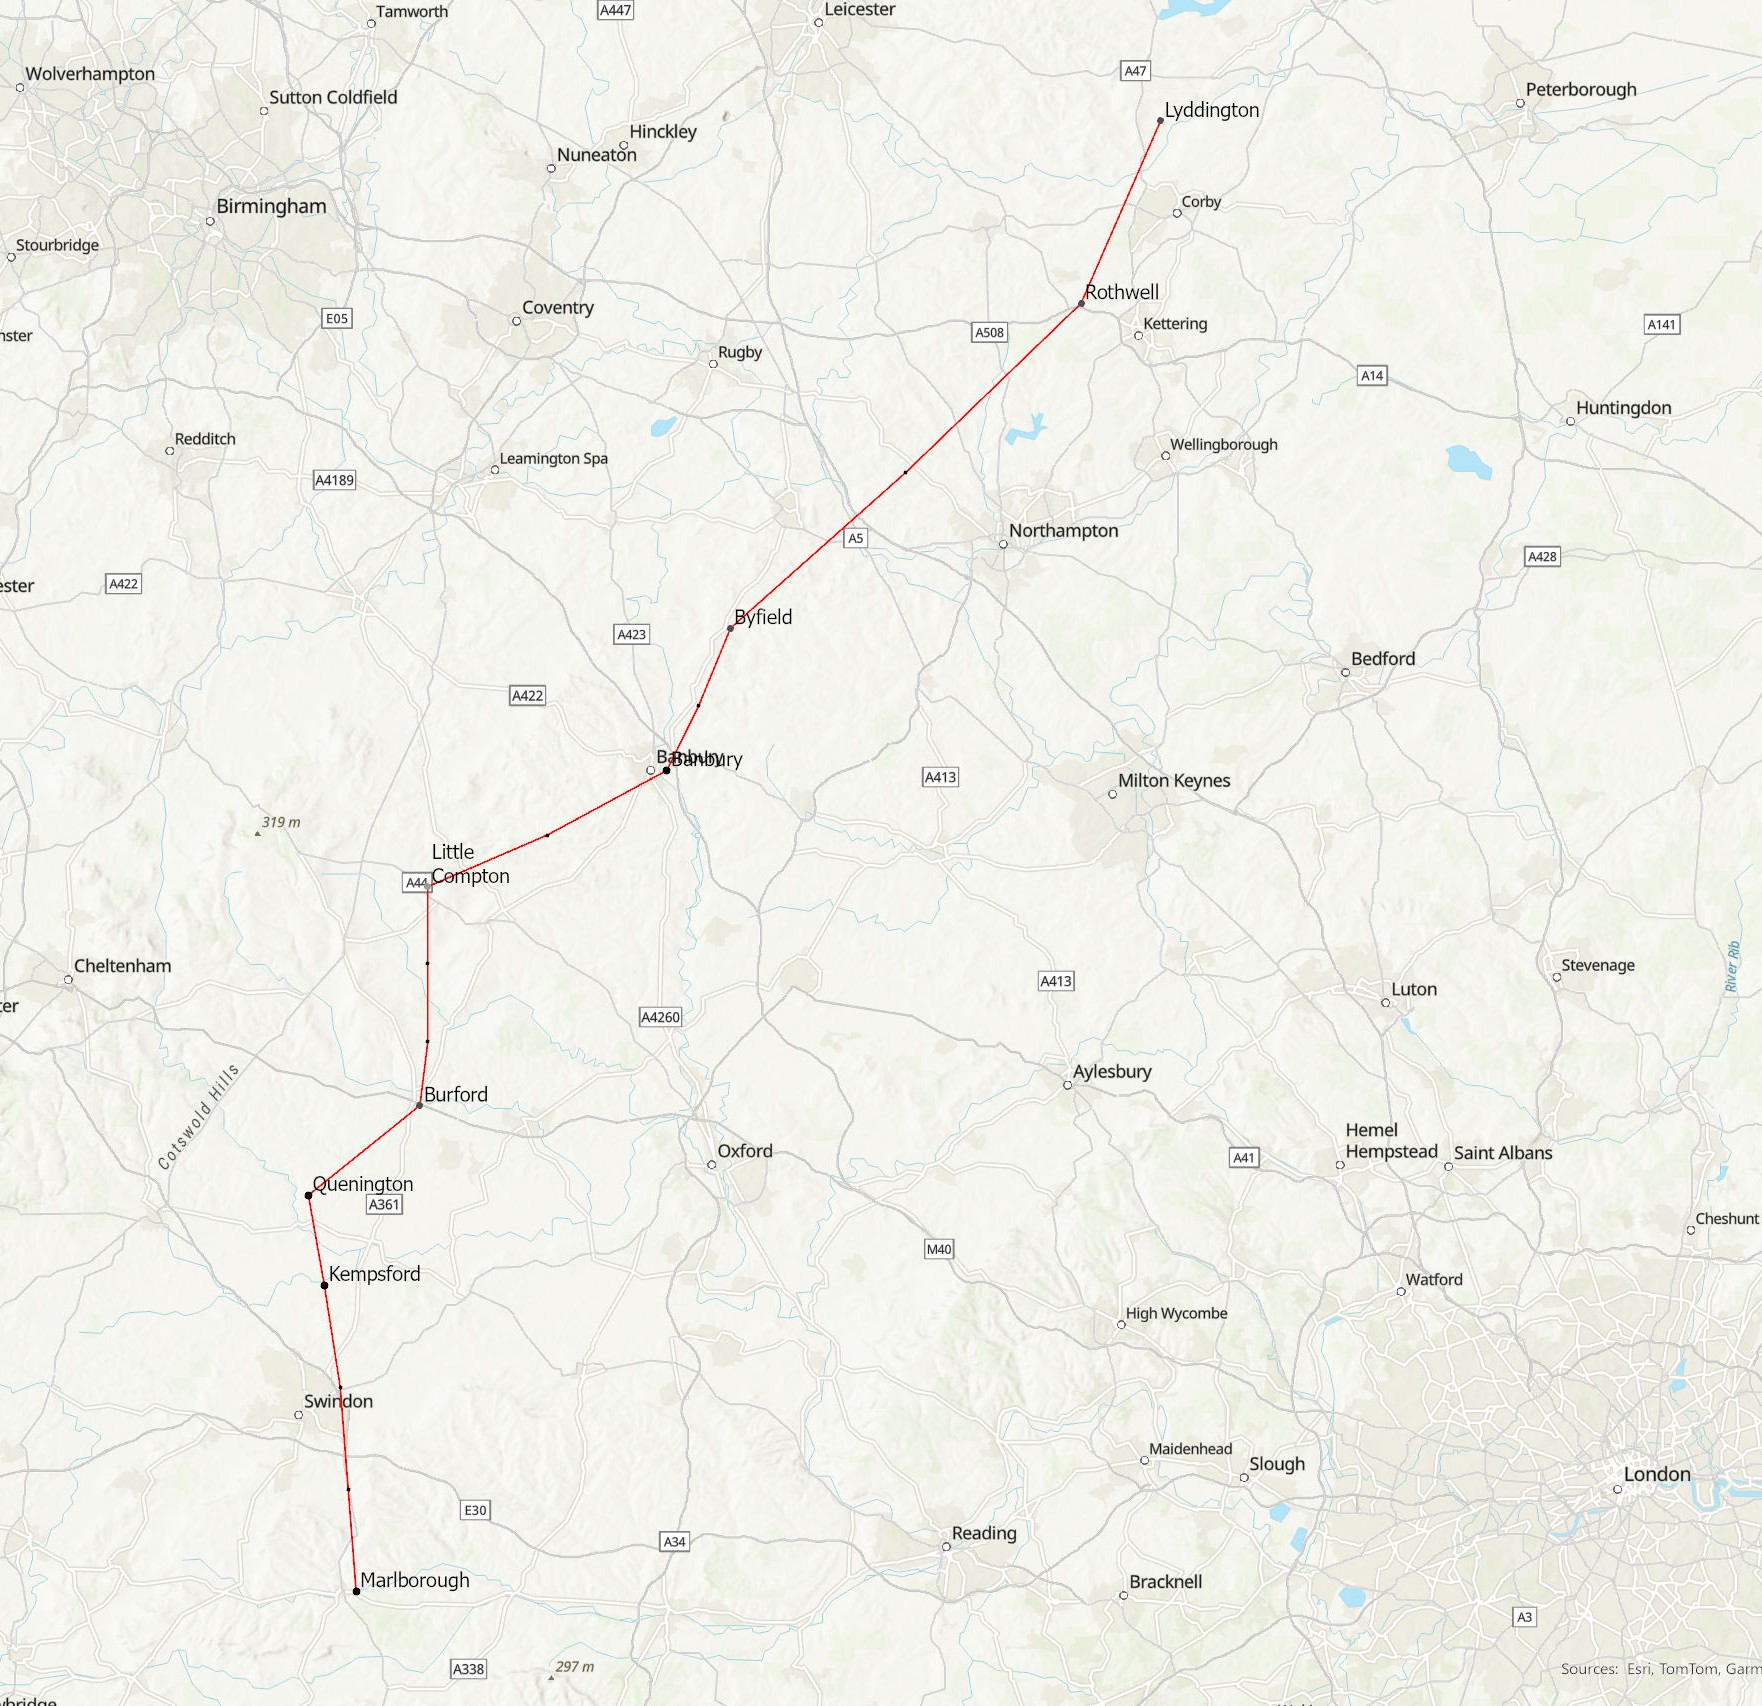
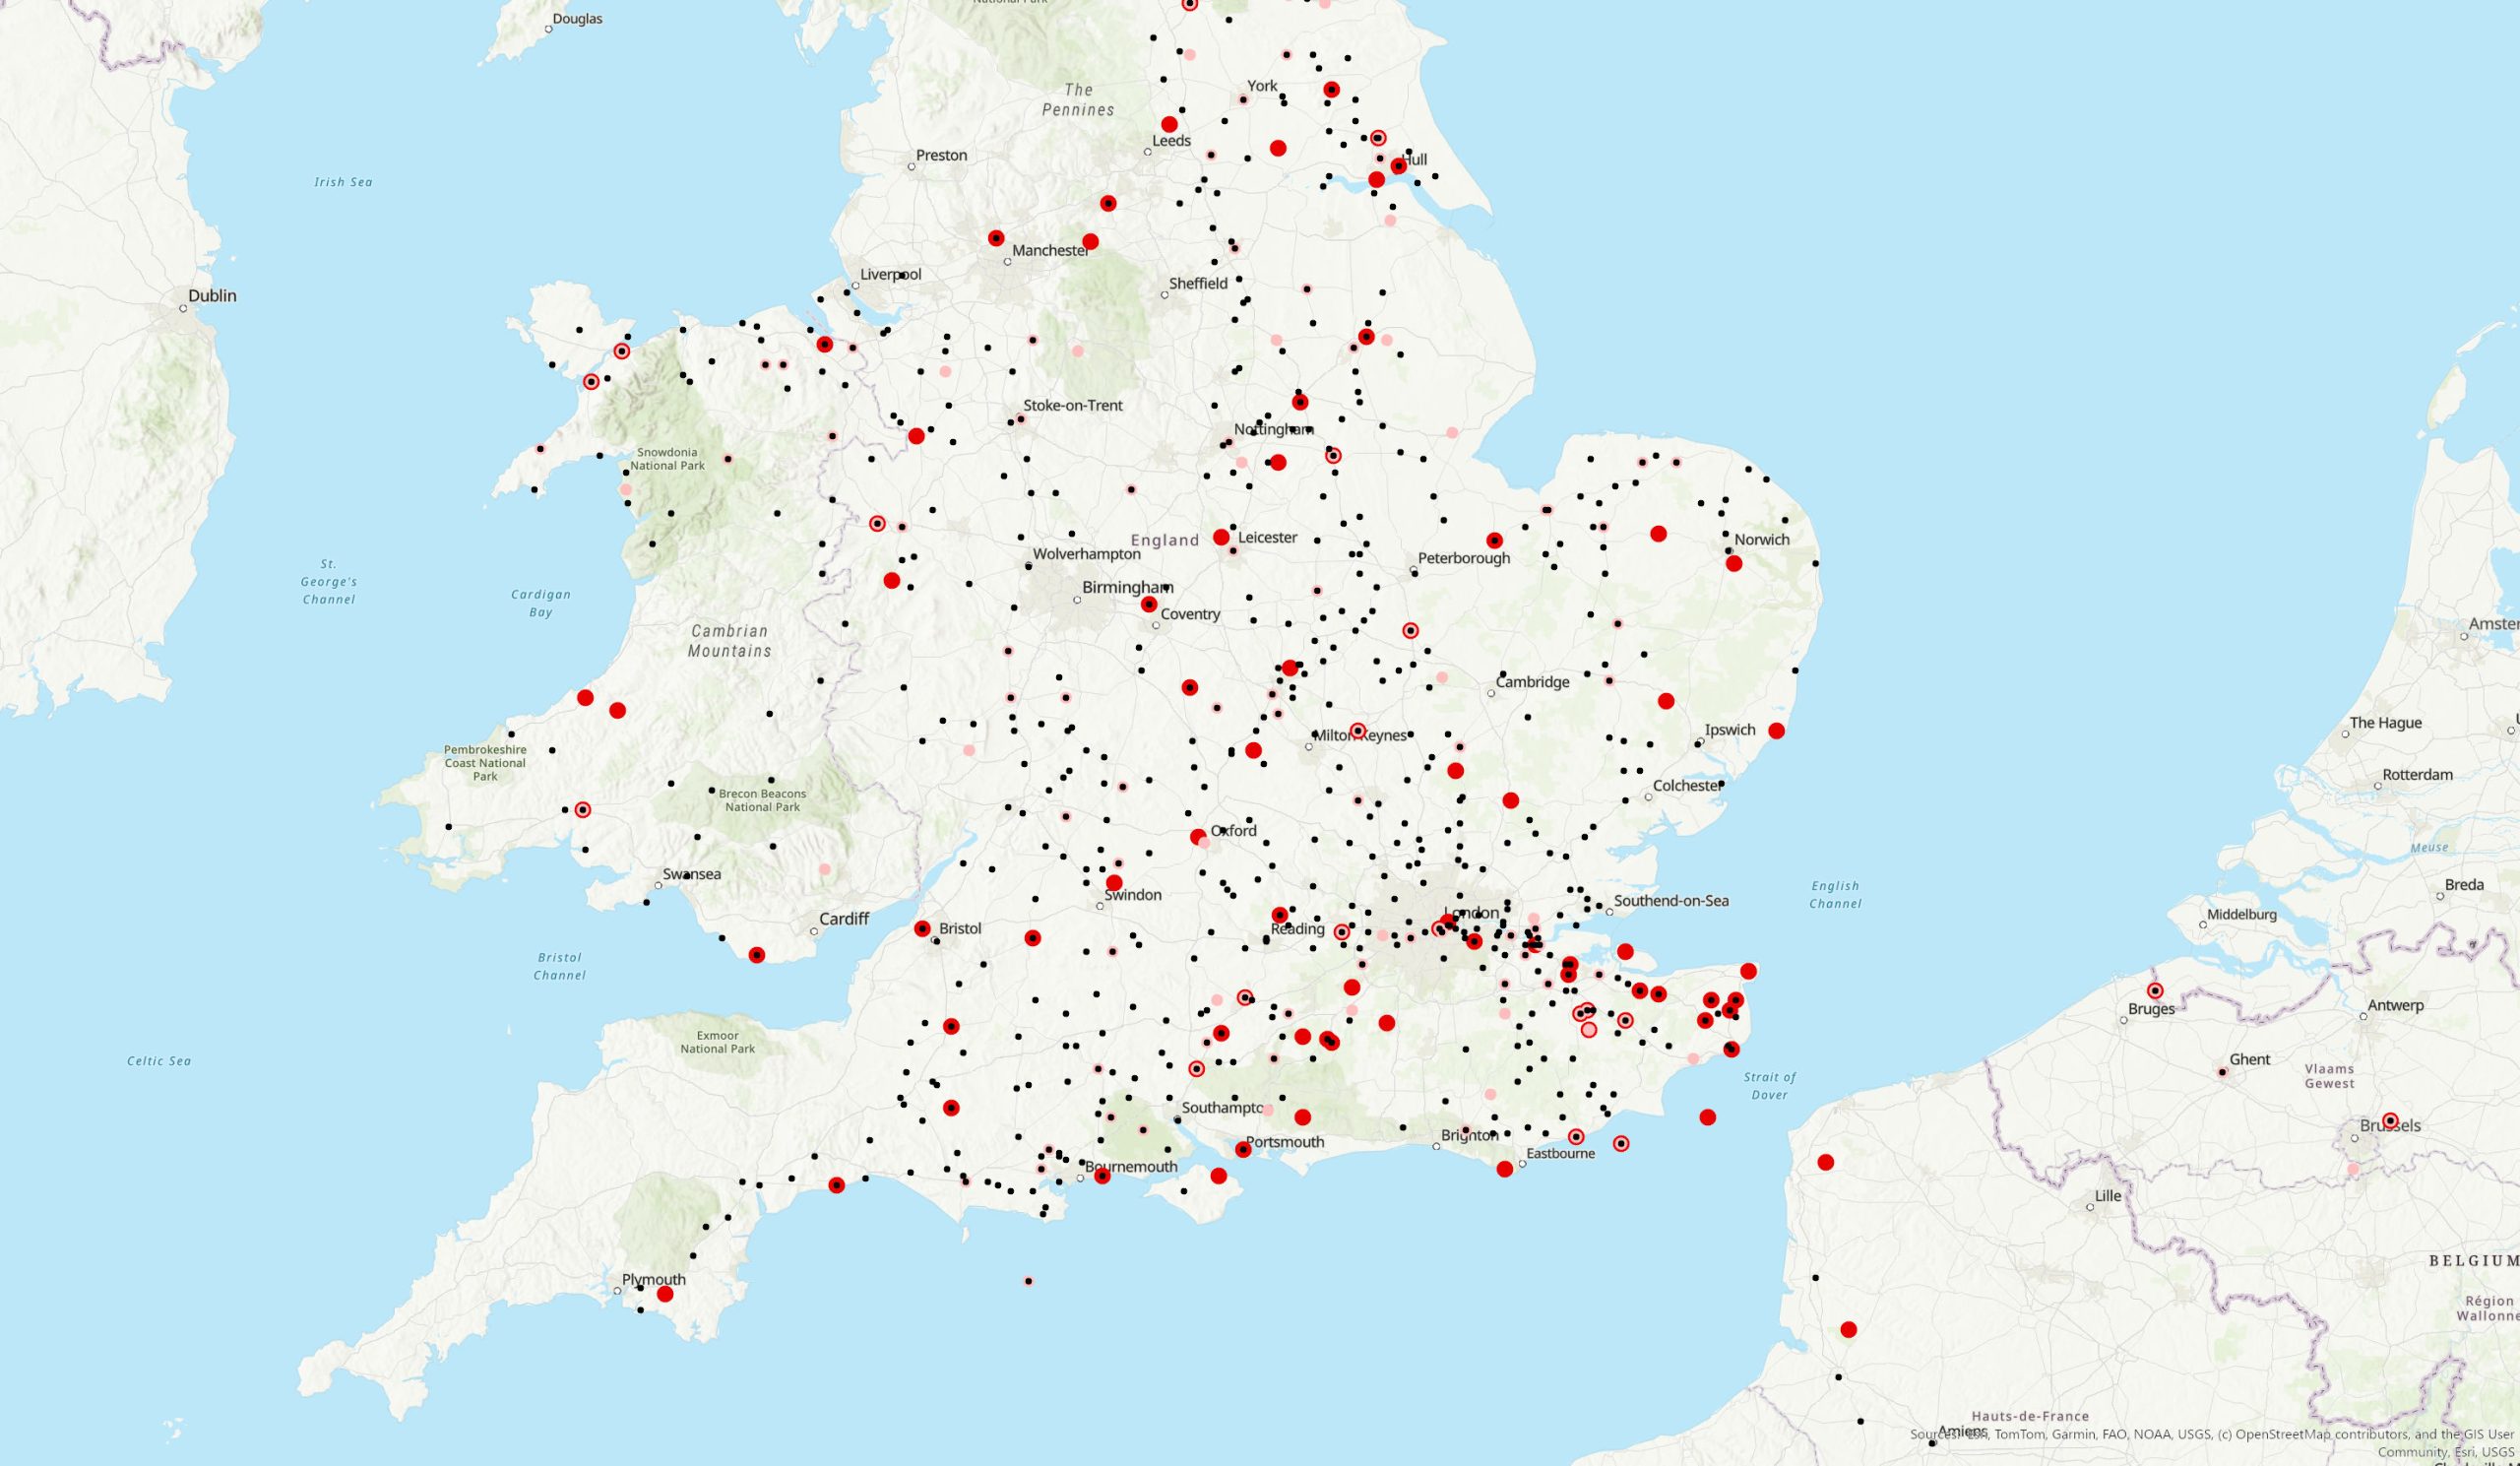
Figure 4
After running this script and then importing the output into ArcGIS, we were able to produce the following map (Figure 4)
The map allows you to see that there are a lot of problems with the dataset, but here are the statistics for how many itinerary records are OK, and how many need attention:
- Identified Locations:
- 7774 have not been checked, but seem good
- 31 have been checked or added and seem good
- 30 have been checked or added with questionable confidence
- 25 have been checked or added with low confidence
- 292 require an implausible travel distance
- 143 require an impossible travel distance
- Interpolated Locations:
- 846 are static (so a good guess)
- 1919 are a reasonable travel distance
- 63 are an improbable travel distance
- 18 are an impossible travel distance
- Unmapped:
- 887 were unmapped
We were surprised to find the number of unmapped itinerary dates, but it turned out that they were records in the “Locations” table where the latitude and longitude fields were null.
Addressing Identified Problems:
Once we identified a list of issues, we needed a way to easily focus on the problematic records and track the changes that we made. The form in Figure X meets this need. The problematic records are highlighted in yellow or red. Since the color coding does not change when the errors are addressed, the checkbox on the far right of the form allows us to mark off the issues as we address them.
This, of course, begs the question of the methodology used for addressing the problematic records. It should be noted, that while we lay out the full idealized methodology below, and we attempted to follow it, the process is always a little more messy and ad hoc than we would like.
For illustrative purposes, we have picked the month of June, 1305 to walk through this process. Figures W-Z are, respectively:
- Figure 5: The source material from Gough
- Figure 6: The same dates in the QA/QC form
- Figure 7: Mapping a walking route of a subset of those dates (June 14-29) on Google Maps
- Figure 8: A map showing the initial locations for the month in red, and the final resolved locations (and route) in green.
We refer to these figures in more detail below while giving specific examples of our QA/QC methodology.
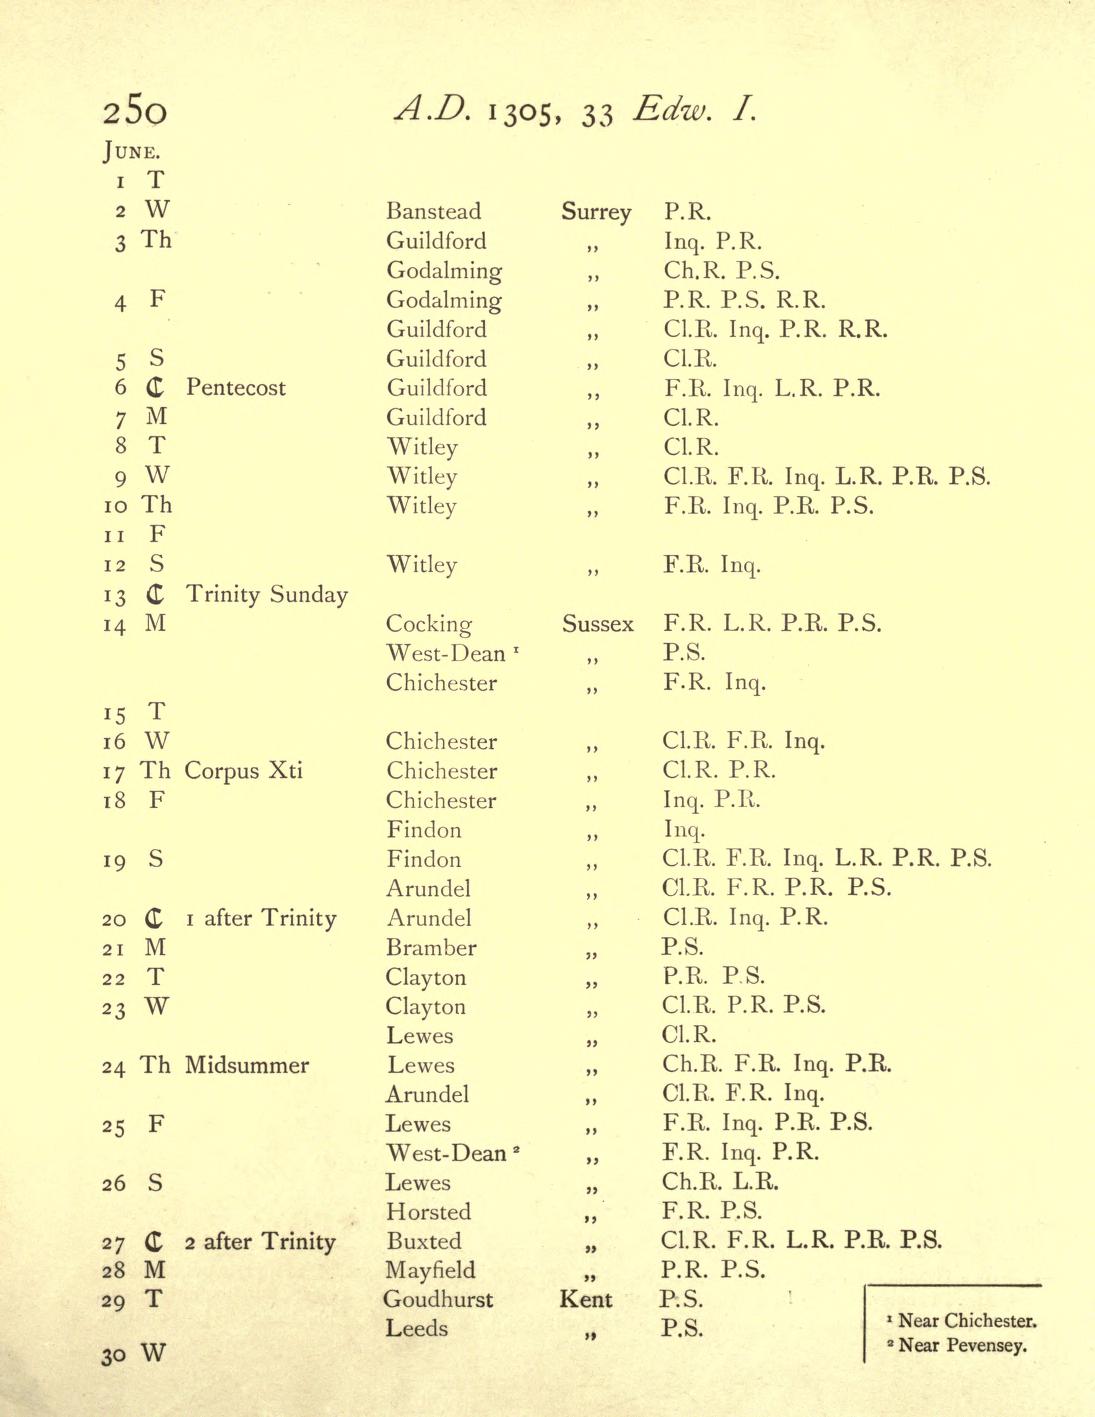
Figure 5
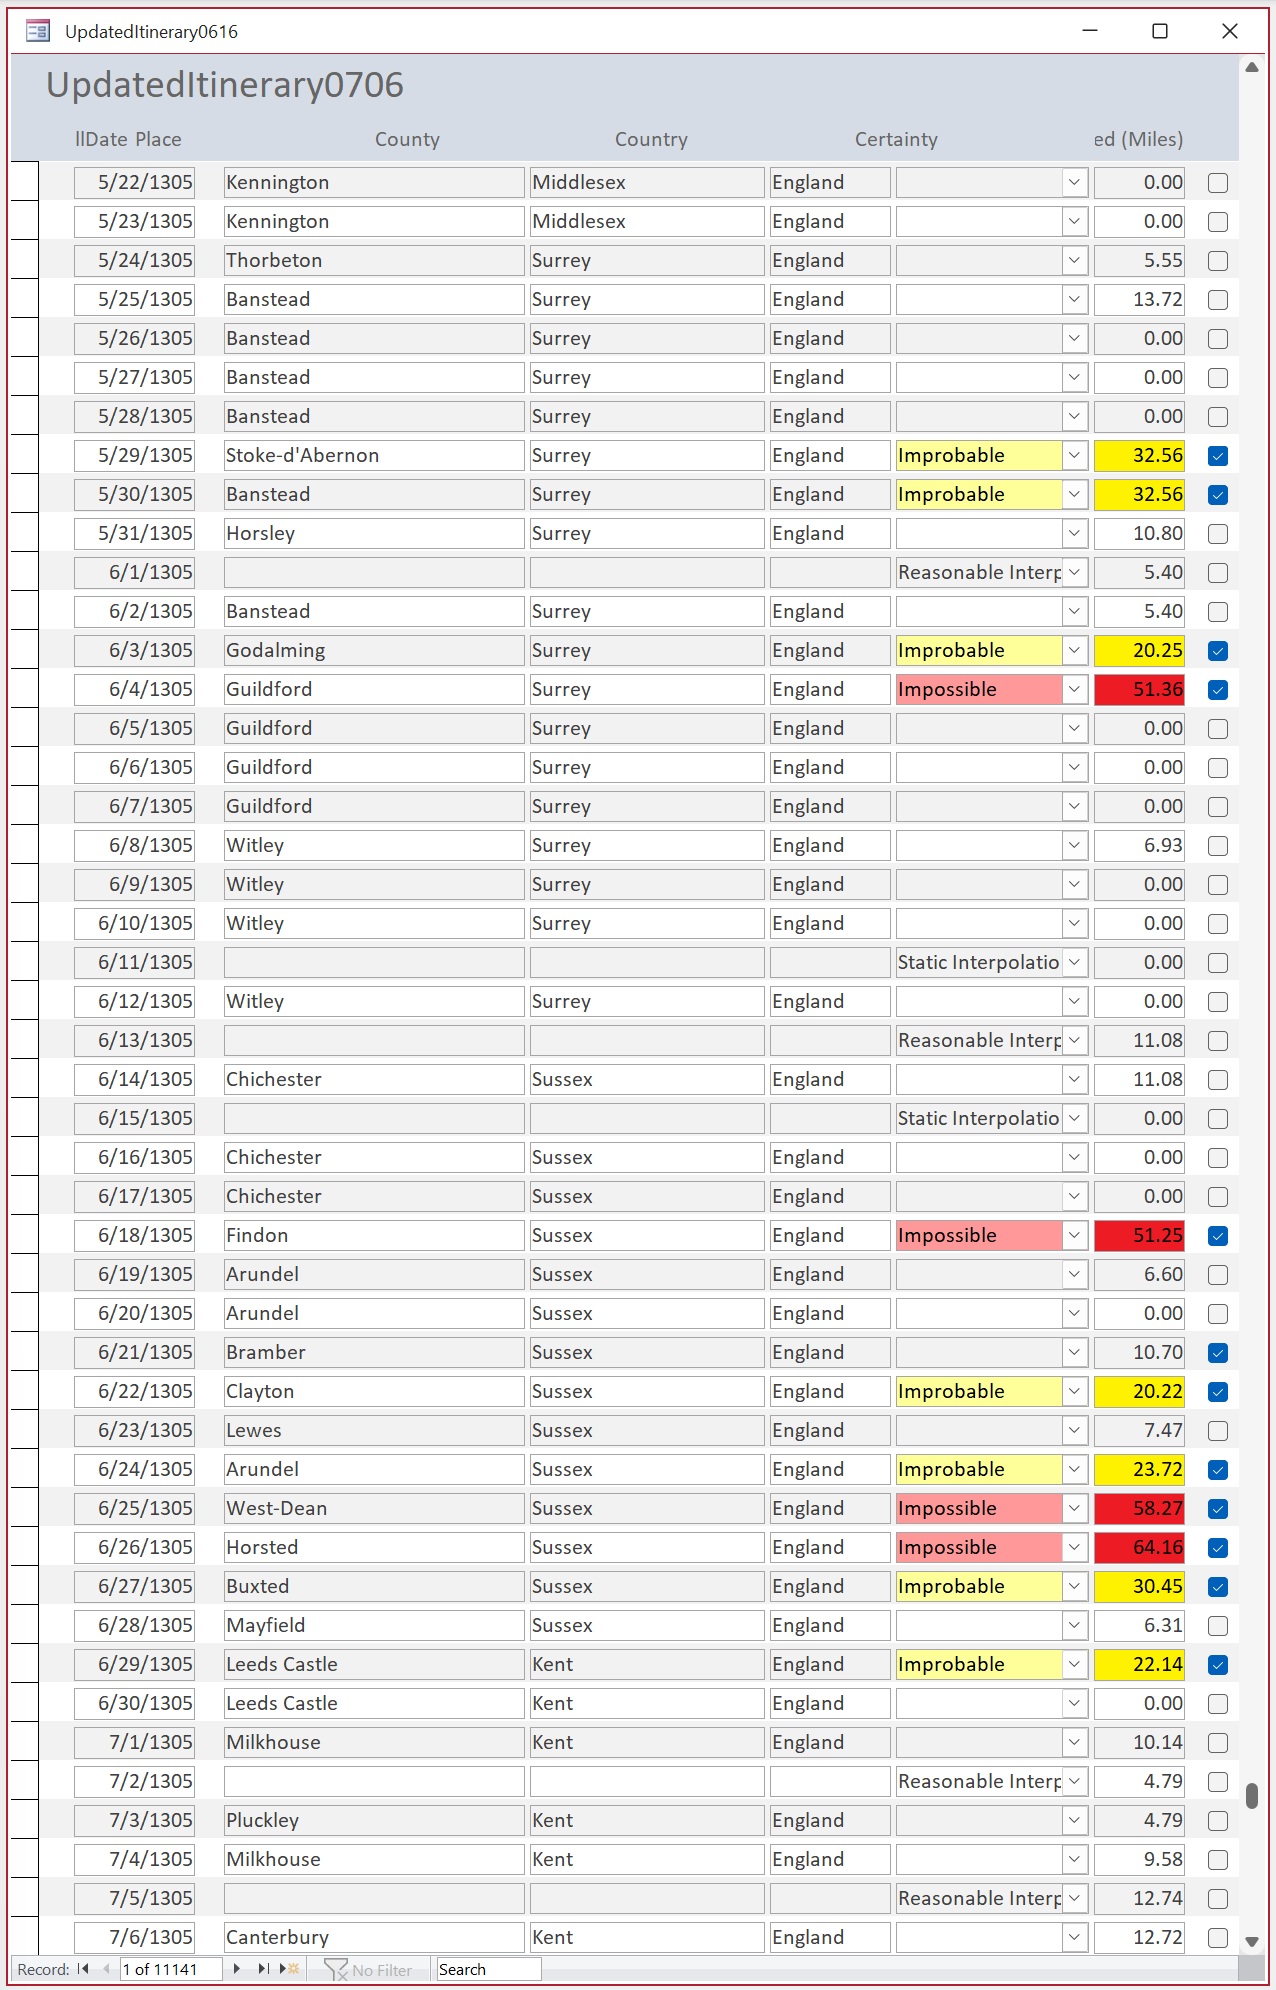
Figure 6
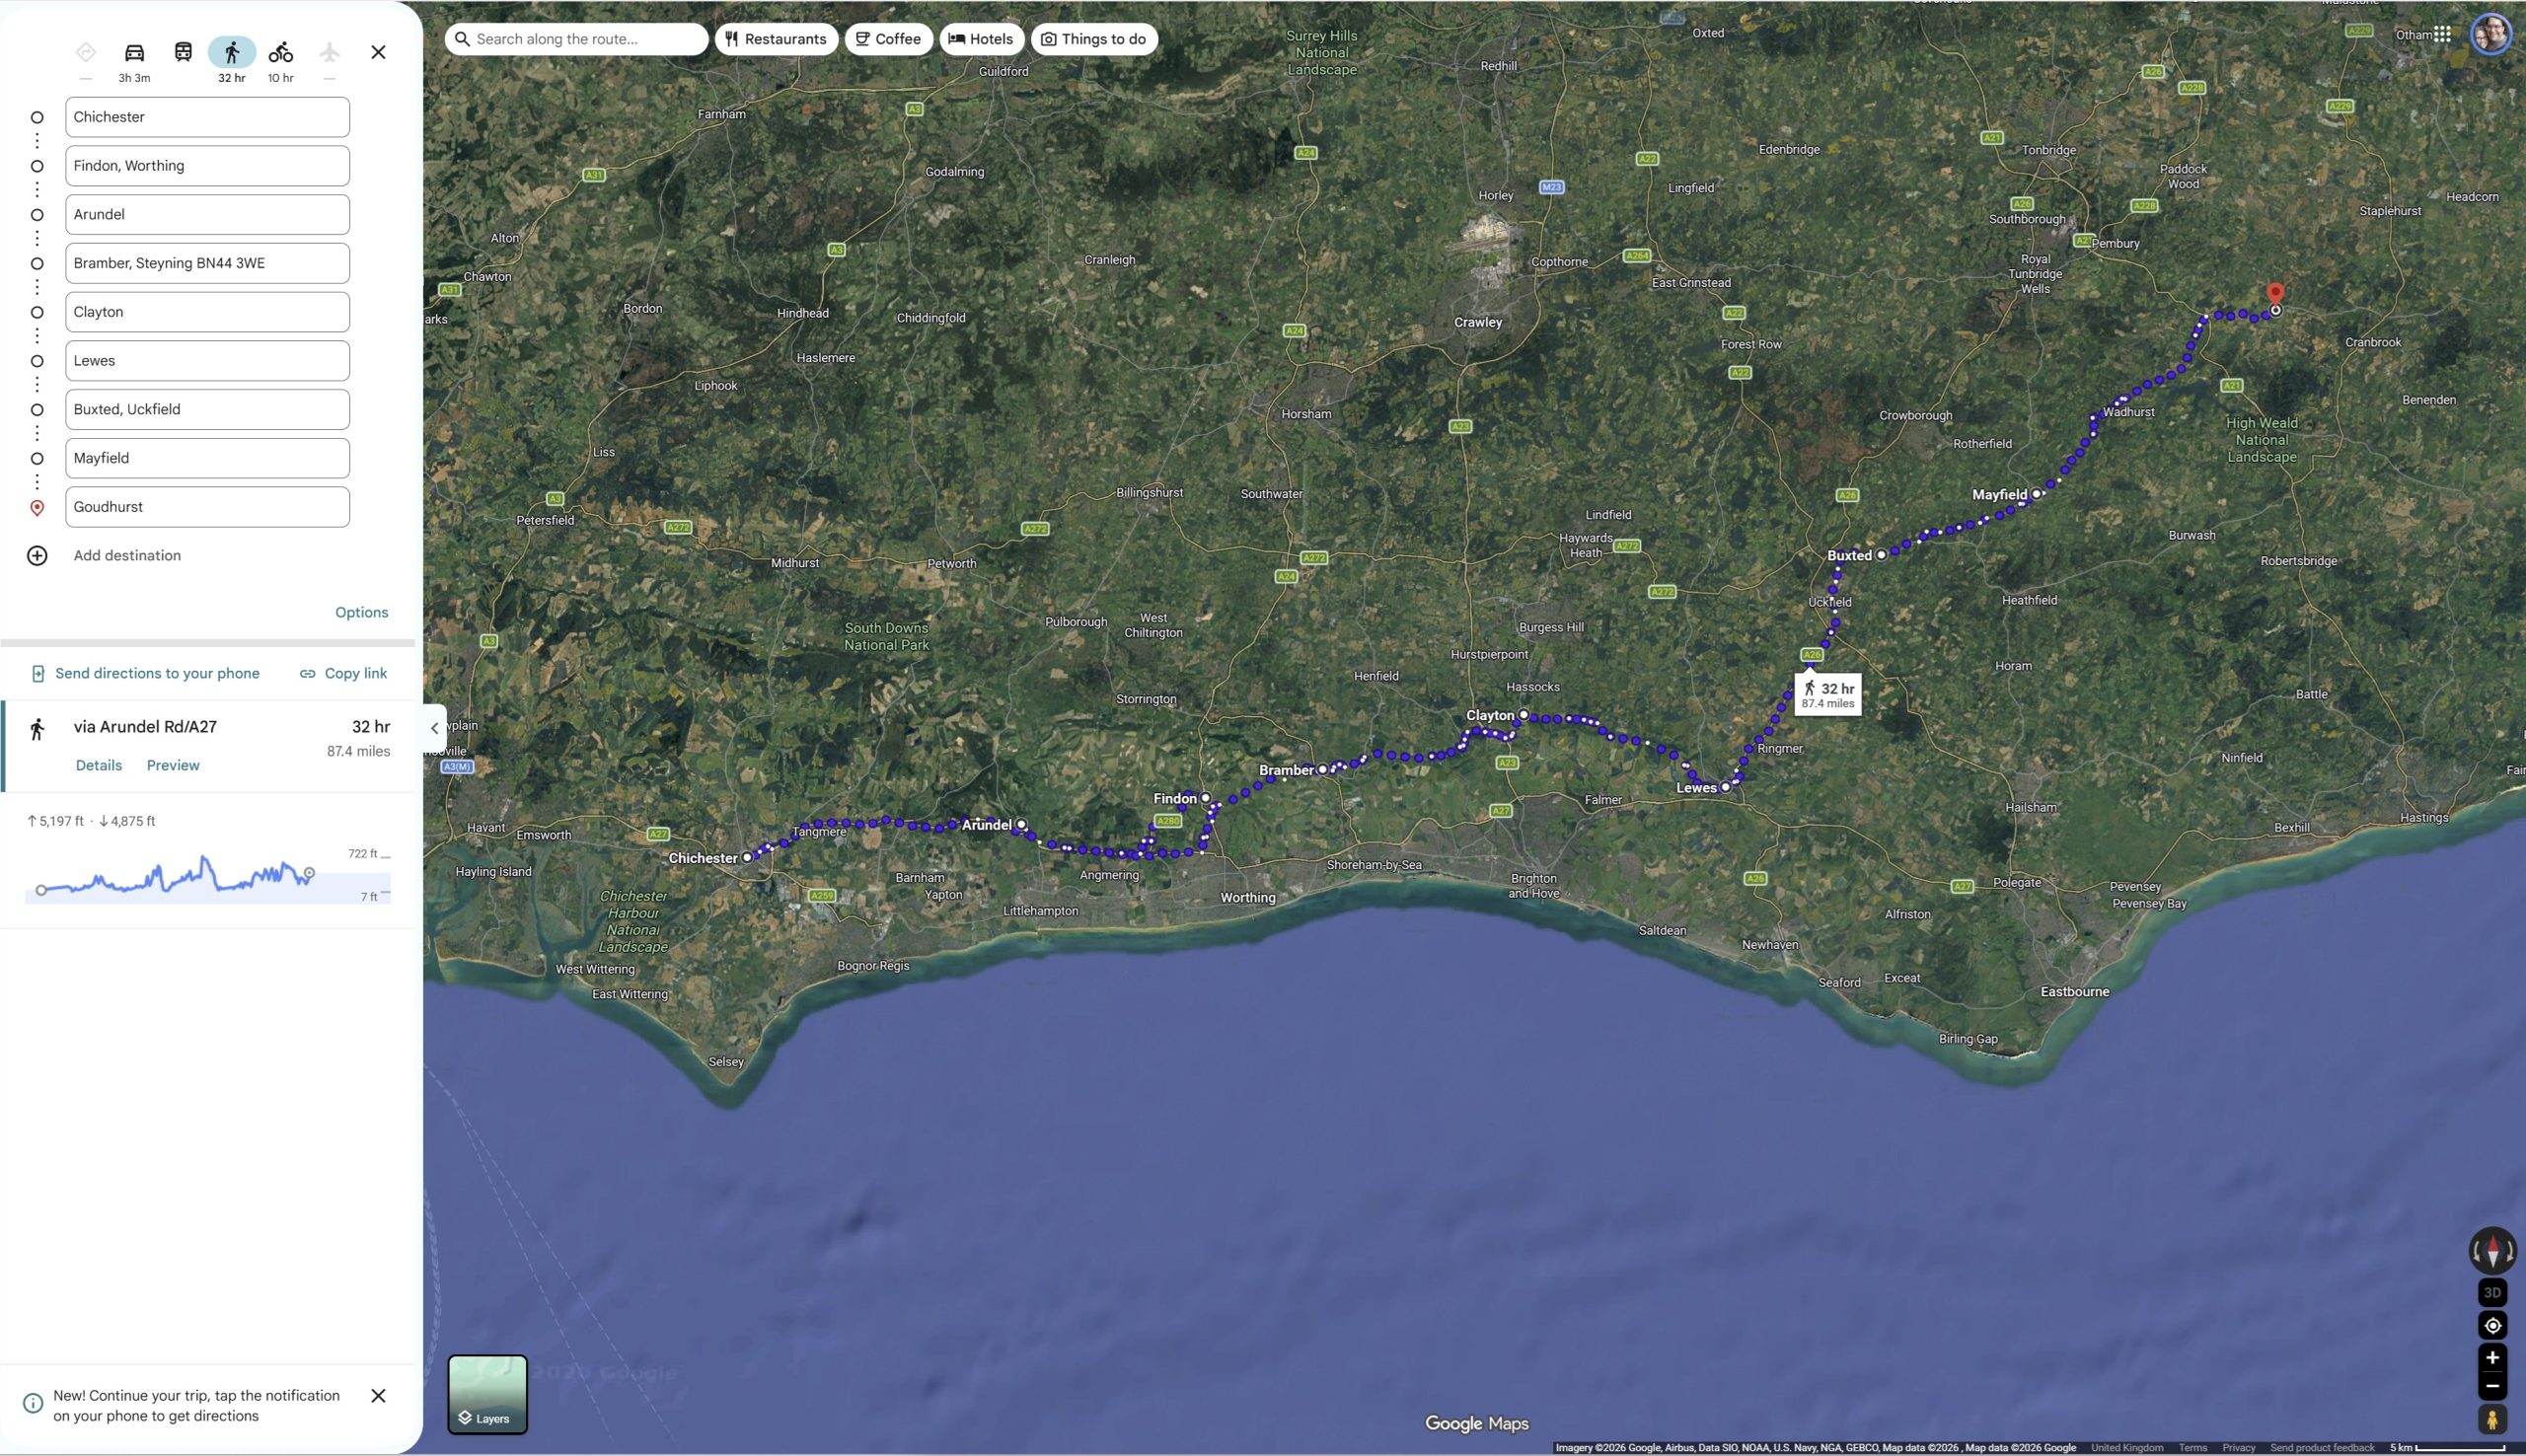
Figure 7
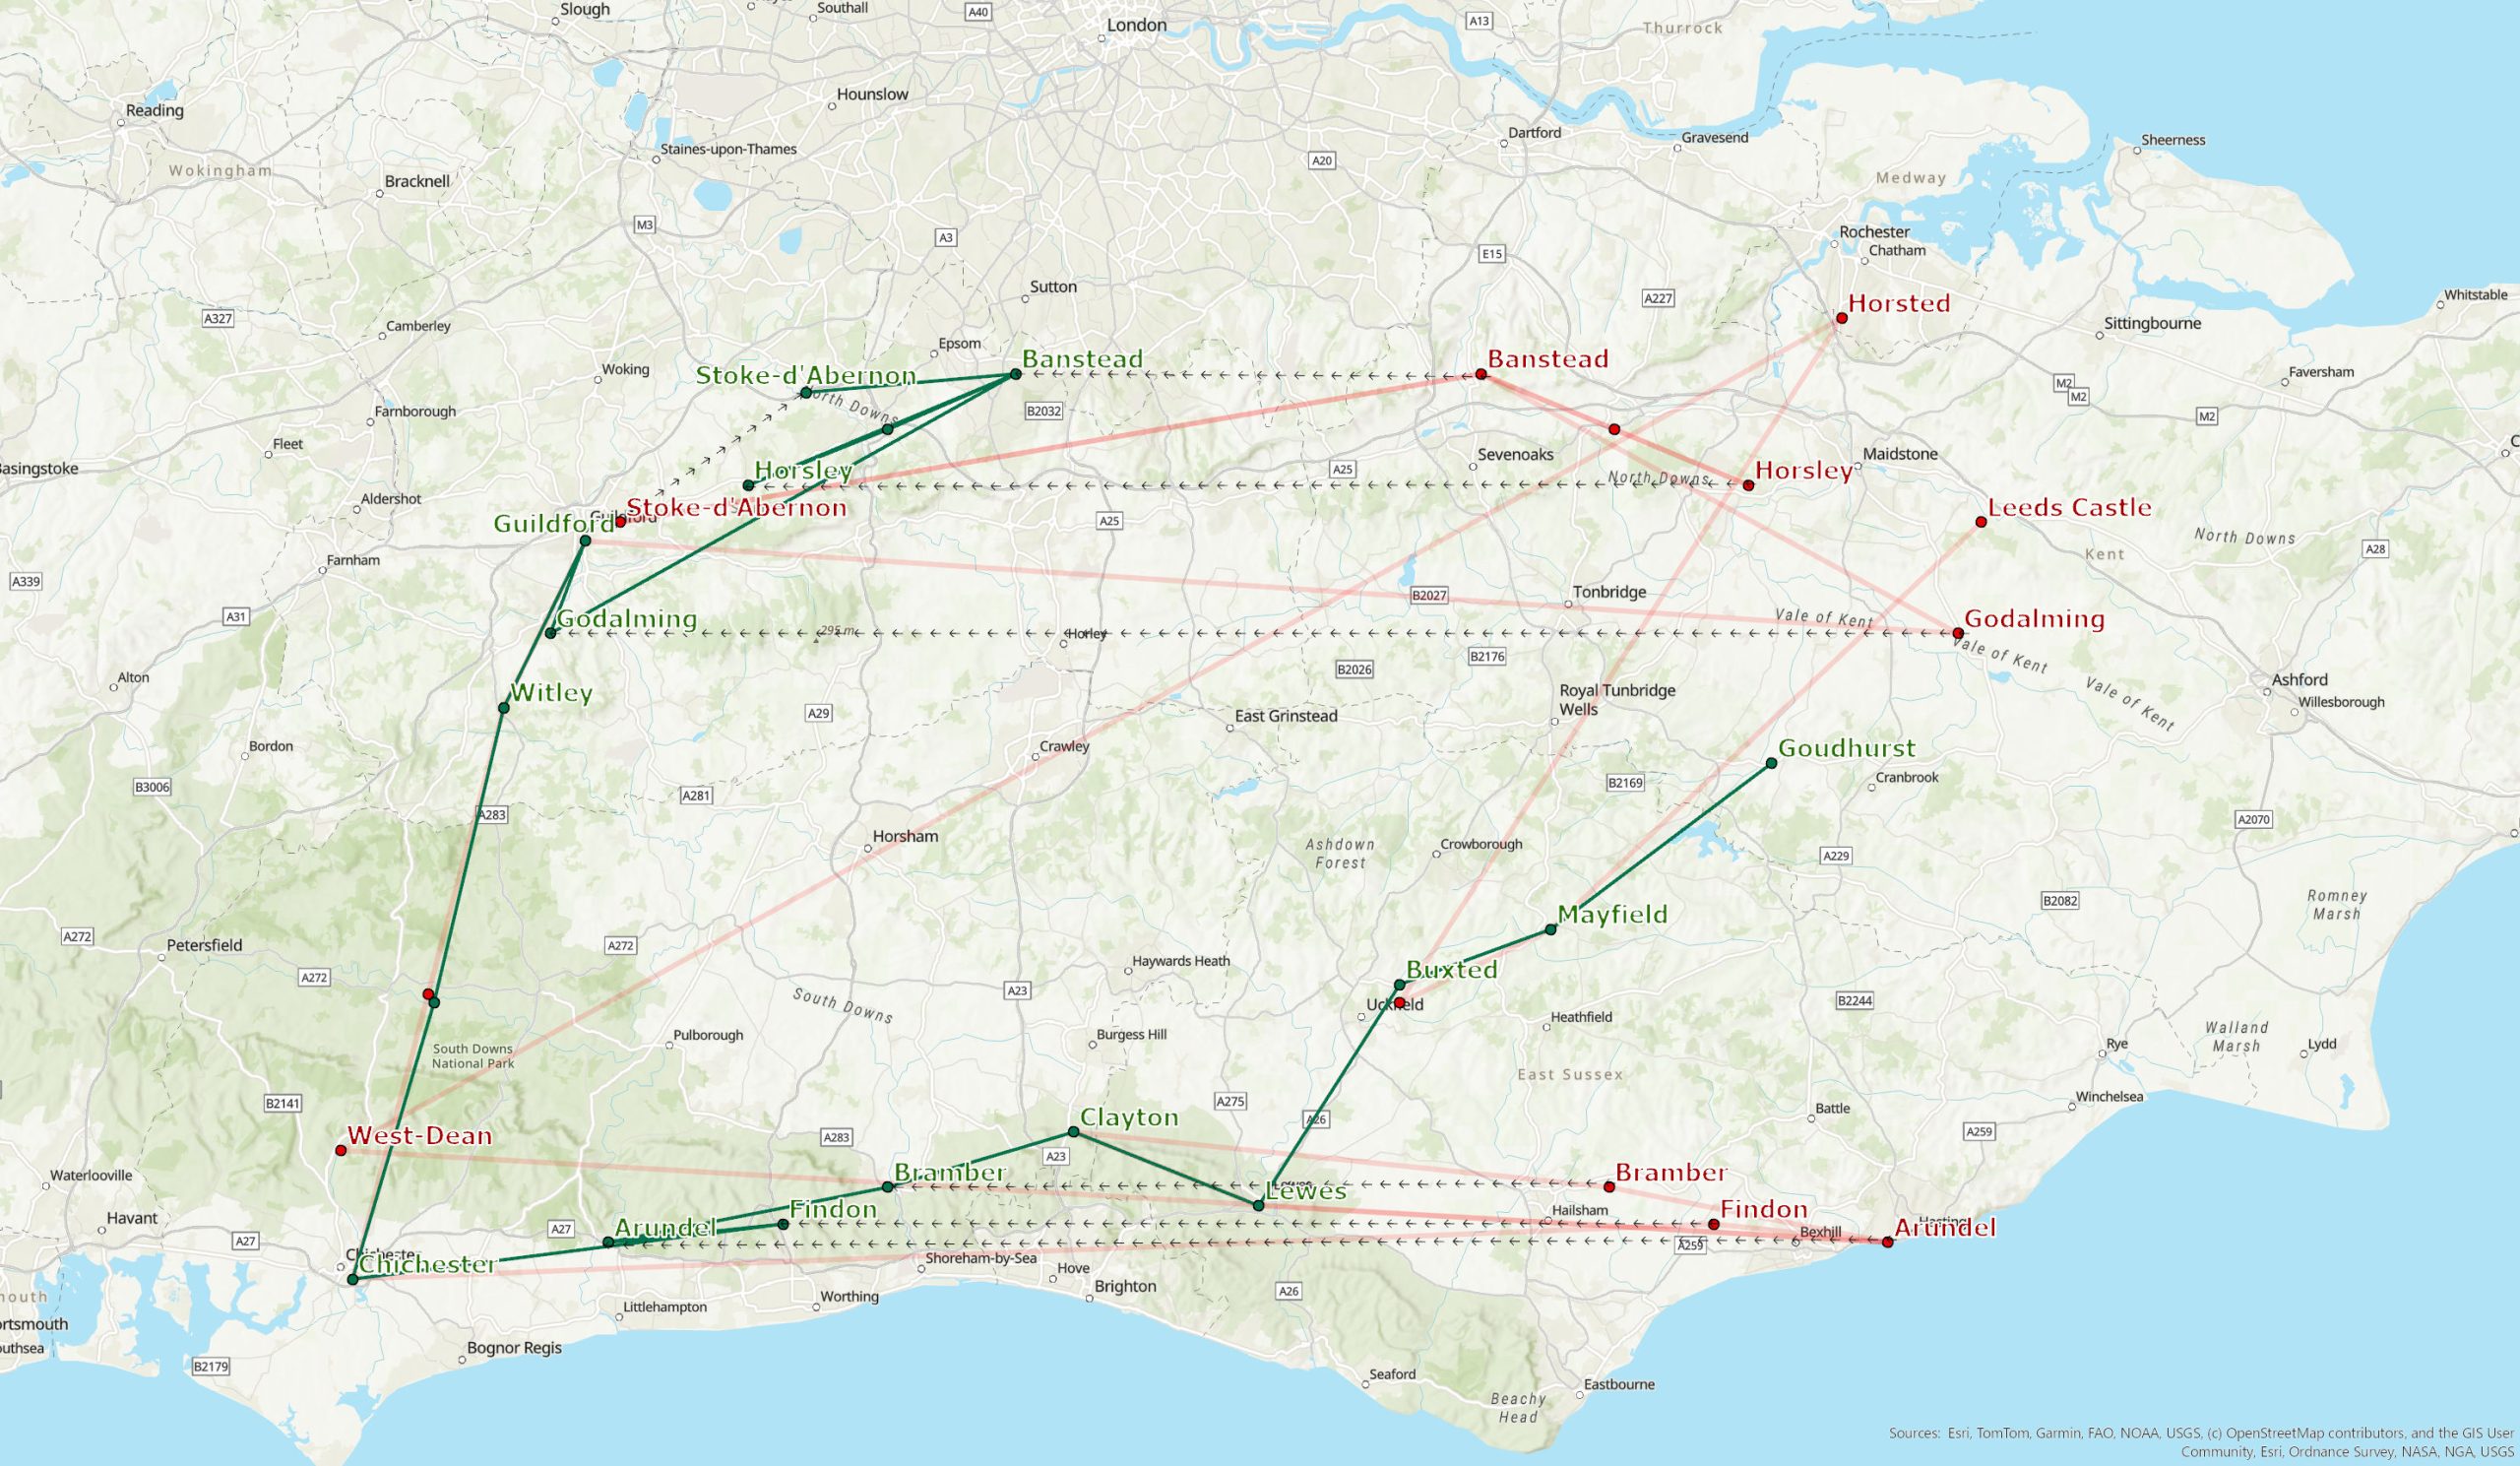
Figure 8